Comparing 11th Gen Intel Core i7 Mobile Processors – where performance & efficiency go hand-in-hand
Laptops powered by 12th generation Intel Core i7 processor are out but they are still far and few. Majority of the high performance laptops out there are still powered by the 11th generation processors. And, if you are in the market for one with Intel Core i7, here is what you need to know.
Intel is enjoying a good run with its 11th generation Intel Core-i processors. Together with strong Intel Iris Xe Graphics performance and the company training its focus on efficiency, performance, long battery life and fast charging with the Intel Evo platform, it is a good time to get a laptop powered by the processor. More so the Intel Core i7 for performance and efficiency. The question we ask is which one? Here, we compare the performance and efficiency of all the Intel Core i7 processors powered laptops currently out there.
RELATED: Intel 11th Gen (Rocket Lake) Still Makes Sense, and Here’s Why
Overview
Here is a quick look at the 11th generation Intel Core i7 mobile processors currently powering today’s laptops. They can be divided into two distinct lines, the G7 and H series. G7 being the energy efficient part and H series for high performance. All but one, the Intel Core i7-11800H is an octa-core processor, the rests are quad-core, eight thread processors. The typical TDP or Thermal Design Power of the G7 series ranges from 15W to 28W making them kinder to the battery. On the other hand, the typical TDP of the H series ranges from 35W to 45W. They run hotter at higher temperature which means they drain the laptop battery faster with higher power consumption. Now, let’s look at how these perform.
| Graphics | Cores/Threads | Clockspeed | Turbo Speed | TDP Typical | TDP Down | |
|---|---|---|---|---|---|---|
| Intel® Core™ i7-11800H Processor | Intel Iris Xe Graphics | 8C/8T | 2.3GHz | 4.6GHz | 45W | 35W |
| Intel® Core™ i7-11390H Processor | Intel Iris Xe Graphics | 4C/8T | 3.4GHz | 5.0GHz | 35W | 28W |
| Intel® Core™ i7-11370H Processor | Intel Iris Xe Graphics | 4T/8T | 3.3GHz | 4.8GHz | 35W | 28W |
| Intel® Core™ i7-1195G7 Processor | Intel Iris Xe Graphics | 4C/8T | 2.9GHz | 5.0GHz | 28W | 12W |
| Intel® Core™ i7-1185G7 Processor | Intel Iris Xe Graphics | 4C/8T | 3.0GHz | 4.8GHz | 15W | 12W |
| Intel® Core™ i7-1165G7 Processor | Intel Iris Xe Graphics | 4C/8T | 2.8GHz | 4.7GHz | 15W | 12W |
11th Generation Intel Core i7 Performance Compared
You will soon find out below, the clock speed and the turbo speed frequencies are not good indicators of a processor’s performance especially among processors with the same number of cores and architecture.
And, while generally, the model numbers are a good guide to pick a processor by there are exceptions where bigger or higher model numbers do not relate to higher performance.
Then there is the Thermal Design Power rating, denoted by the heat transferred in Watts when the processor is in use. Here, you have a typical, up or down TDP rating. We will refer to the typical TDP throughout this article. This is how much power the processor will consume with average workload and typical running frequency.
On the other hand, TDP down refers to low power mode where the processor is clocked down, literally to a low frequency sometimes known as base frequency to reduce power consumption and optimise battery life. 11th generation processors feature a TDP down rating.
On the flip side, TDP up is the maximum heat that a processor will produce when running at high frequency, higher than the frequency at typical TDP. We see this rating in the 12th generation processor. this means, it can offer a burst of performance when pushed but consume more power.
| Graphics | Cores/Threads | Clockspeed | Turbo Speed | TDP Typical | TDP up | |
|---|---|---|---|---|---|---|
| Intel® Core™ i7-1260P Processor | Intel Iris Xe Graphics G7 | 12C/16T | 2.1/1.5GHz | 4.7/3.4GHz | 28W | 64W |
TDP down and TDP up are used by manufactures to configure the performance of the machine by changing its base frequency accordingly to suit the thermal design, chassis and active cooling design of their laptops.
Overall Average Performance and Single Thread Performance
Benchmark tools look at different aspects of a system. We will be considering the overall average score of a CPU and its single thread rating, two fundamental benchmark scores that gives a good picture of a system’s performance. See below, Average CPU Mark and single thread ratings based on PassMark software and results submitted by users.
| Ave CPU Mark | Single Thread | Ave CPU Mark/Watt | |
|---|---|---|---|
| Intel® Core™ i7-11800H | 21447 | 3140 | 476.60 |
| Intel® Core™ i7-11390H | 10804 | 3024 | 308.69 |
| Intel® Core™ i7-11370H | 12172 | 3033 | 347.77 |
| Intel® Core™ i7-1195G7 | 11090 | 3108 | 396.07 |
| Intel® Core™ i7-1185G7 | 11026 | 2911 | 735.07 |
| Intel® Core™ i7-1165G7 | 10604 | 2877 | 706.93 |
Benchmark scores derived from CPU Benchmarks using PassMark Software
The fastest 11th generation Intel Core i7 processor is unsurprisingly the one with the most number of cores. The Intel® Core™ i7-11800H processor is an octa-core, eight thread processor. It is twice as fast as all the quad core processors on the list when comparing the average CPU Mark rating. The single thread performance however paints a different picture. The Core i7-11800H processor is not far off the mark when compared with all the quad core processors. Taking the Intel Core i7-1165G7 as baseline, the fastest Core i7-11800H is just 9% faster.
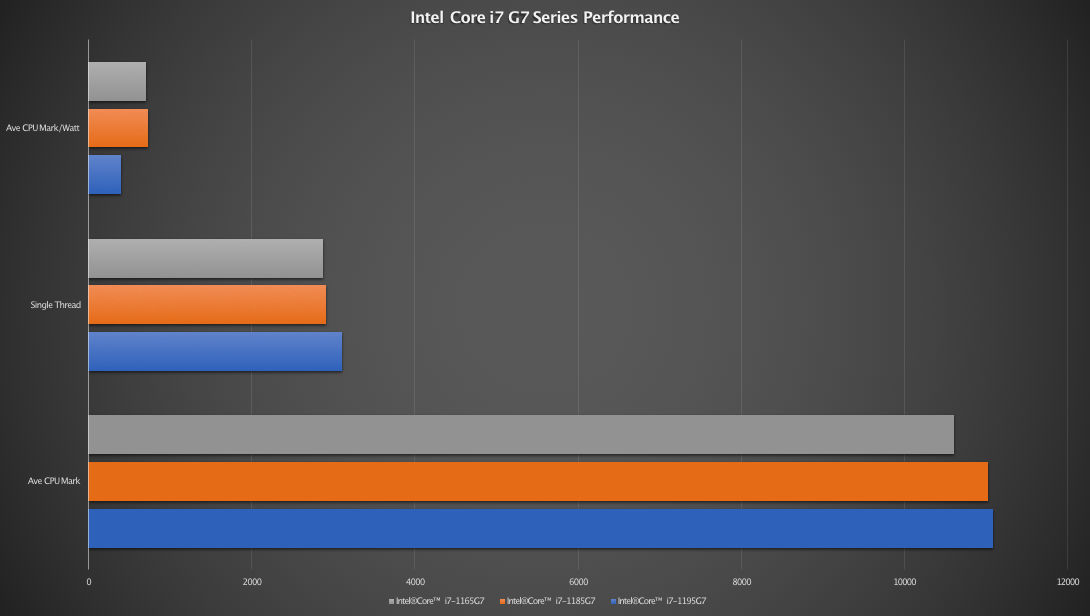
Intel Core i7 G7 Series Performance
When considering the G7 series, the biggest jump in performance is undoubtedly the Intel Core i7-1195G7 with an 5% performance gain, followed by Intel Core i7-1185G7 with a 4% performance gain when compared to Intel Core i7-1165G7. In normal use, 5% and 4% aren’t going to be much. So it is not going to make a huge difference picking one over the other. Single thread performances paint a similar picture, with 8% and 1% gain respectively. See the chart below for illustration.
Intel Core i7 H Series Performance
When considering the H series, the octa-core Intel Core i7-11800H will not only return the highest performance but will be the most expensive laptop by comparison. However, the other two quad-core H series processors tell a different story. Based on their average CPU Mark, you may want to avoid Intel Core i7-11390H altogether. Eventhough it has a higher model number, it is power hungry and loses out to the lower model Intel Core i7-11370H and two out of three of the G7 series. It is only faster than the Intel Core i7-1165G7 (baseline) by a small 2% margin. If you want a real boost in performance from the H series, pick the Intel Core i7-11800H. See chart below for illustration.
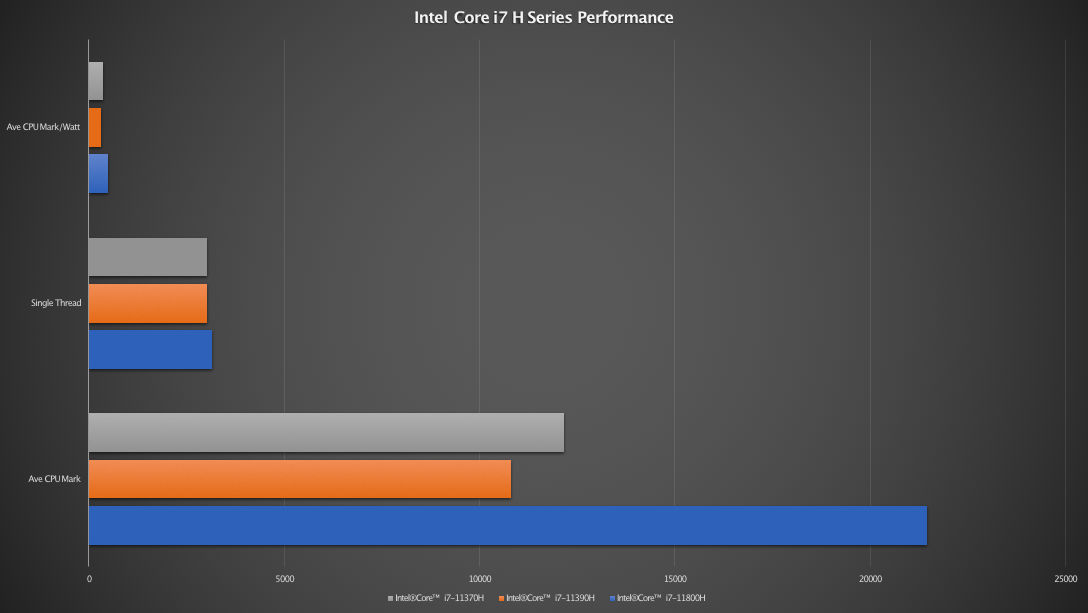
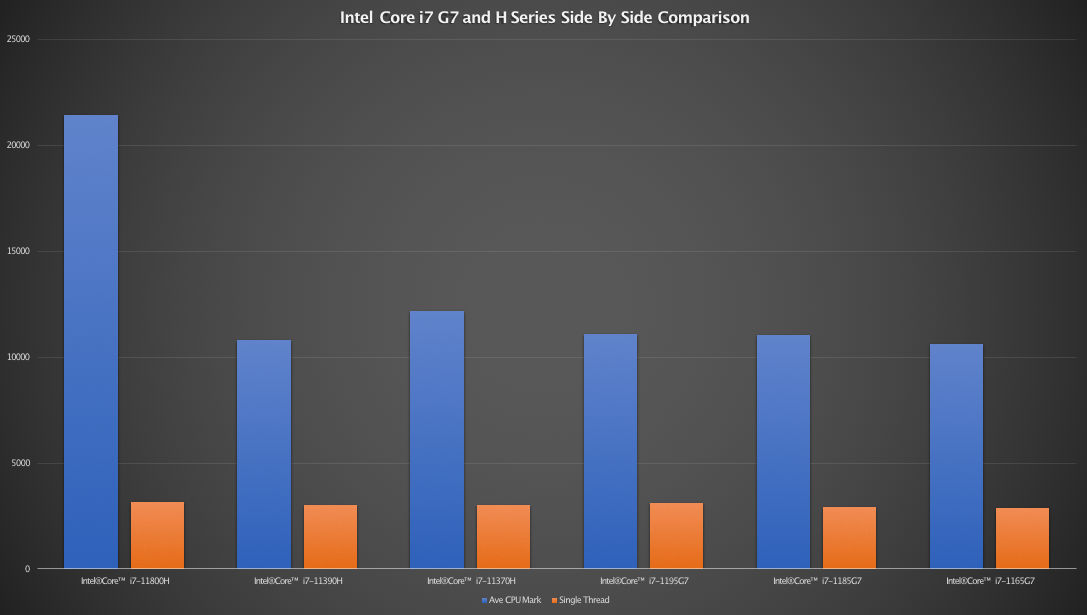
For an overall look at performance comparing both G7 and H series processors, we plot the following graph combining data from both series.
| Ave CPU Mark | Single Thread | |
|---|---|---|
| Intel® Core™ i7-11800H | 21447 | 3140 |
| Intel® Core™ i7-11390H | 10804 | 3024 |
| Intel® Core™ i7-11370H | 12172 | 3033 |
| Intel® Core™ i7-1195G7 | 11090 | 3108 |
| Intel® Core™ i7-1185G7 | 11026 | 2911 |
| Intel® Core™ i7-1165G7 | 10604 | 2877 |
As we have established earlier, there is no real gain choosing between the G7 series. The Intel Core i7-1165G7 is the clear favourite among manufacturers when it comes to their offering, balancing performance and efficiency. The H series however tells a difference story. When choosing performance over efficiency, the only processor that will make a real difference is the chart topping Intel Core i7-11800H.
Performance to Power Consumption Ratio
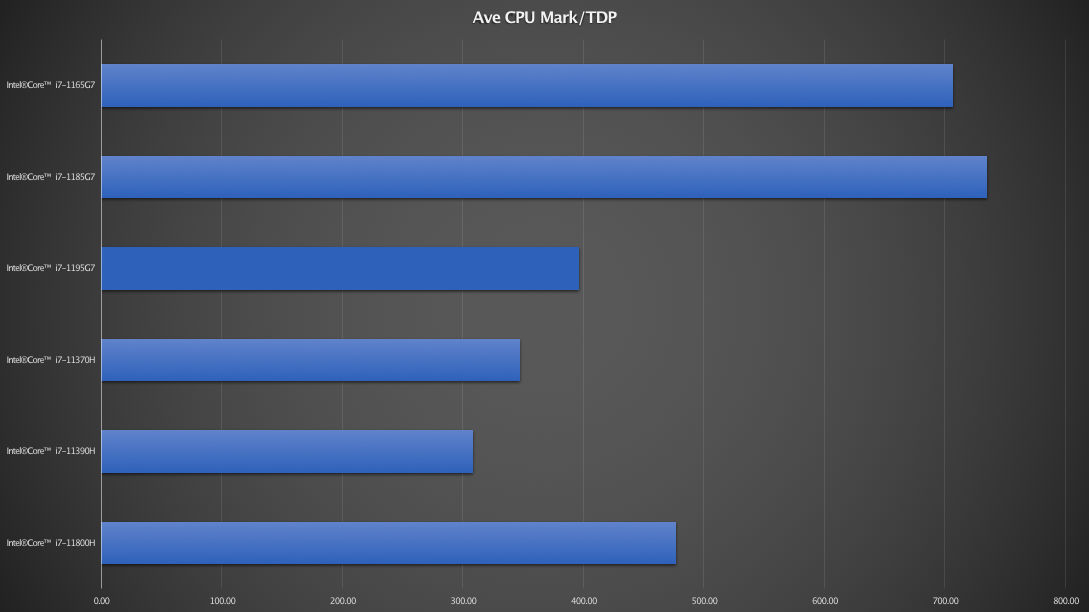
Not everyone wants raw performance. If slim line ultraportable with long battery life and a balance of performance and efficiency is your thing then consider the Average CPU Mark to Thermal Design Power ratio. As we have established, H series processors are more power hungry, while the G7 series are more power efficient. Even among the G7 series, the Intel® Core i7-1195G7 Processor has a much higher typical TDP at 28W as oppose to 15W on the Core i7-1185G7 and Core i7-1165G7. The small 5% performance gain does not quite justify the increase in power consumption. Here is the table comparing the performance to power consumption ratio.
| Ave CPU Mark | Single Thread | Ave CPU Mark/TDP | |
|---|---|---|---|
| Intel® Core™ i7-11800H | 21447 | 3140 | 476.60 |
| Intel® Core™ i7-11390H | 10804 | 3024 | 308.69 |
| Intel® Core™ i7-11370H | 12172 | 3033 | 347.77 |
| Intel® Core™ i7-1195G7 | 11090 | 3108 | 396.07 |
| Intel® Core™ i7-1185G7 | 11026 | 2911 | 735.07 |
| Intel® Core™ i7-1165G7 | 10604 | 2877 | 706.93 |
The processor that manages to squeeze the most performance per watt is the Intel Core i7-1185G7. This is followed by the Intel Core i7-1165G7 and the Intel Core i7-11800H. The ratio is almost twice as high on the G7 processors compared to the H processor, see first two top bars and the bottom most bar above. If you are looking for the best performing processor that is also kind on the battery, choose the Intel Core i7-1185G7 or the Intel Core i7-1165G7.
Summing Up
Here is a quick summary of the processors in our list
- Intel® Core™ i7-11800H Processor – HIGHEST PERFORMER
- Intel® Core™ i7-11390H Processor
- Intel® Core™ i7-11370H Processor – SECOND HIGHEST PERFORMER
- Intel® Core™ i7-1195G7 Processor
- Intel® Core™ i7-1185G7 Processor – HIGHEST PERFORMANCE PER TDP
- Intel® Core™ i7-1165G7 Processor – SECOND HIGHEST PERFORMANCE PER TDP


